- Identical Services, Different Settings, Higher Prices
- Price Variation for Common Procedures
- Patient Health Status and Price Variation
- Prices Vary Across and Within Local Markets
- Implications for Purchaser Strategies
- Notese
- Technical Appendix
- Supplementary Tables
- Data Source
Identical Services, Different Settings, Higher Prices
Many medical services—for example, an MRI scan—are provided both in hospital outpatient departments (HOPDs) and community settings, such as physician offices and freestanding imaging or ambulatory surgical centers (ASCs). Services commonly provided in both settings include laboratory tests, physical therapy, outpatient surgery, standard and advanced imaging, physician visits, and noninvasive and invasive procedures, such as endoscopy or cardiac catheterization.
Private insurers and Medicare generally pay more for services provided in hospital outpatient departments. Hospitals justify the higher payments by citing higher overhead costs related to stand-ready capacity for emergencies and additional regulatory requirements, such as the obligation to screen and stabilize all patients with a medical emergency regardless of their ability to pay.1 A key question for purchasers is whether the higher cost for routine, nonemergency services in HOPDs is justified when the same services are widely available at lower prices in community settings.
Several trends heighten the importance of investigating the gap between HOPD prices and community-based prices for routine, nonemergency services. Increased spending on HOPD services is playing a major role in overall spending growth for both publicly and privately insured people because of increases in both prices and quantities.2 The Medicare Payment Advisory Commission (MedPAC) has questioned whether these site-of-service payment differences are warranted and has recommended that Medicare pay for routine physician evaluation and management visits provided in hospital outpatient departments at the same rate as services provided in community-based physician offices. Such a move would reduce the cost of an average Medicare HOPD physician visit by 56 percent and would save an estimated $1 billion to $5 billion over five years.3 More recently, MedPAC recommended reducing or eliminating the differences in Medicare payment rates between outpatient departments and physician offices for 66 specific categories of ambulatory services—a move estimated to reduce patient cost sharing alone by $200 million per year.4
Recent increases in the employment of physicians and acquisition of community-based physician practices by hospitals, along with hospitals purchasing ambulatory surgical centers and other community-based facilities, are resulting in more and more services being paid at higher hospital outpatient rates.5 The payment differentials likely have accelerated the trend of hospital acquisition of physician practices, which is contributing to growing provider market power.6
This analysis examines the prices paid by private insurers for routine services—knee MRIs, colonoscopies, several laboratory blood tests and physical therapy—that account for significant spending. The analysis uses 2011 claims data for about 590,000 privately insured active and retired nonelderly autoworkers and their dependents to identify price variation for these services based on whether they are provided in hospital outpatient departments or community-based settings (see Data Source).
Back to Top
Price Variation for Common Procedures
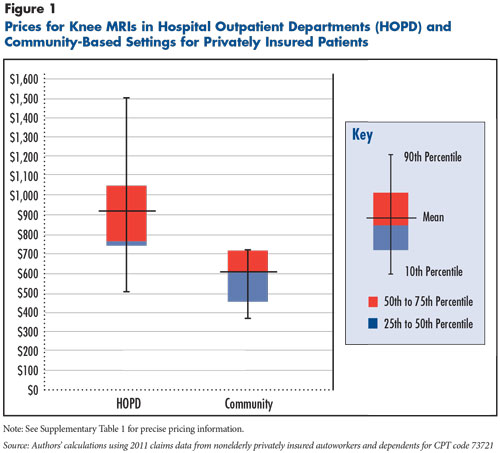
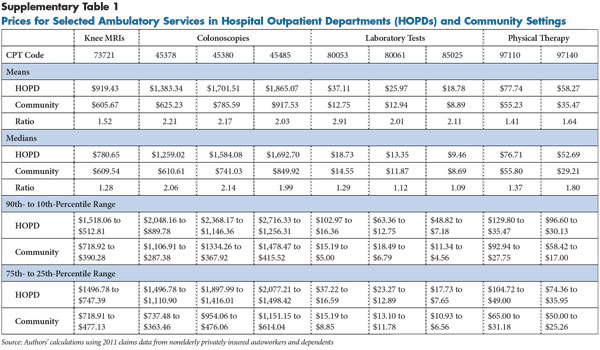
MRIs of the knee. Knee MRIs with contrast (Current Procedural Terminology (CPT) 73721) accounted for $6.5 million of the $48 million spent for nonemergency ambulatory MRIs in 2011 by the autoworker health plans. Based on prices for nearly 7,000 knee MRI scans roughly split between hospital outpatient departments and community-based settings, the average price was 52 percent higher in hospital outpatient departments—$919 vs $606 (see Figure 1).
While median prices for knee MRIs in outpatient departments and community settings were closer, the price distribution differed, with HOPD prices markedly skewing up and community-based prices skewing down from the median. Moreover, price variation for knee MRIs was much greater among HOPDs than community settings. For example, the 90th- to 10th-percentile range was $1,518 to $513 in HOPDs compared to $719 to $390 in community settings.
Colonoscopies. Colonoscopies are considered the most effective colon cancer screening tool and involve insertion of a flexible tube containing a camera for visual inspection of the colon to detect polyps that might be cancerous. If polyps are found, they are typically either sampled to assess whether they are cancerous or removed and tested for cancer.
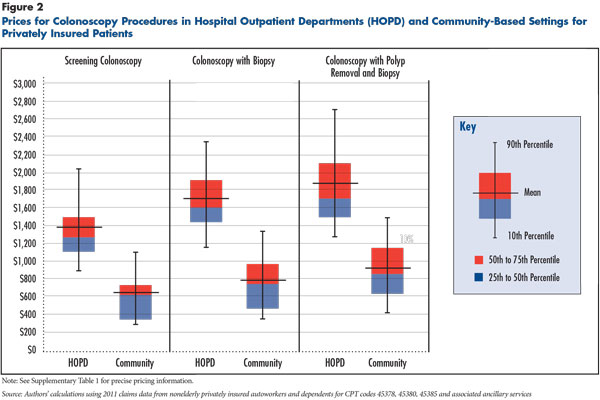
Multiple procedure codes are used for colonoscopies depending on whether polyps are found and sampled or removed. This analysis focused on the three most common procedure codes that arise from screening colonoscopies: no polyps found, polyps found and sampled for pathology tests, and polyps found, sampled and removed—CPT codes 45378, 45380 and 45385, respectively. Nearly 45,000 of these three types of colonoscopies were conducted in 2011 for the study population, accounting for about $23 million in spending, excluding the cost of related services like drugs, anesthesia and pathology tests. Price comparisons are based on claims data for 16,566 colonoscopies with complete and clear information about the site of service—9,782 conducted in HOPDs and 6,784 in community settings. Prices are reported based on a bundle of colonoscopy-related services because some health plans pay a flat amount for the procedure plus ancillary services, rather than on an item-by-item basis.
Both average and median prices for colonoscopies were at least twice as high in HOPDs as in community settings (see Figure 2). For example, the price for a basic colonoscopy where no polyps were found averaged $1,383 in HOPDs compared to $625 in community settings. Colonoscopy price variation in both HOPD and community settings was substantial.
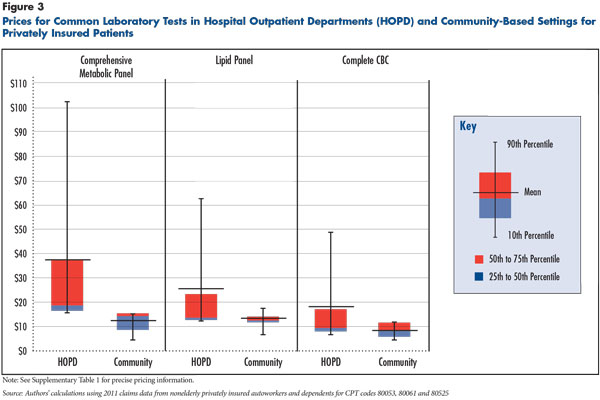
Simple clinical laboratory tests. The analysis examined three common blood tests: a comprehensive metabolic panel that provides a rough check of kidney function, liver function, and electrolyte and fluid balance; a lipid (cholesterol) panel (HDL, LDL, triglycerides); and a complete blood count (CBC) that provides information on the kinds and numbers of cells in the blood—CPT codes 80053, 80061 and 80525, respectively. These tests are used for both screening and diagnostic and monitoring purposes. The tests are automated, and prices are generally below $40, often much lower, but they are prescribed extremely often.
In 2011, the study population received 211,000 comprehensive metabolic panels, nearly 300,000 lipid panels and 265,000 CBCs, for total spending of about $12.2 million. Median prices for these tests were only slightly higher in HOPDs than in community settings, but average prices were two to three times higher, reflecting an extremely skewed price distribution in hospital outpatient departments (see Figure 3).
The most dramatic differences were for comprehensive metabolic panels, with an average HOPD price of $37.11 compared to $12.75 in community settings. Moreover, price variation for comprehensive metabolic panels was dramatically greater among HOPDs than among community settings. For example, the 90th- to 10th-percentile range was $103 to $16 in HOPDs compared to a $15 to $5 range in community settings.
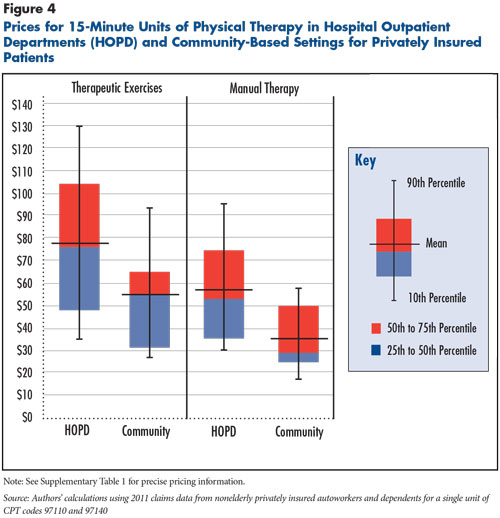
Physical therapy services. The analysis examined two common physical therapy services: therapeutic exercises and manual therapy—CPT 97110 and 97140, respectively. In the study population, these two services in 2011 accounted for about $25.9 million of the $38 million in total spending on physical therapy. These and many other physical therapy services are provided in 15-minute units, and price comparisons are based on a single unit of service.
Among autoworkers, physical therapy is more commonly provided in community settings, with less than 20 percent of visits provided in HOPDs. Nevertheless, the study population in 2011 received about 136,000 physical therapy services in hospital outpatient departments. Average prices were 41 percent and 64 percent higher in HOPDs for therapeutic exercises and manual therapy, respectively, than in community settings. For example, a 15-minute unit of manual therapy was $58 on average in HOPDs compared to $35 in community settings (see Figure 4). The distribution of prices was only modestly greater in HOPDs than in community settings, and the degree that the HOPD price distribution skewed higher, though evident, was not as pronounced as for clinical lab tests and other services.
Back to Top
Patient Health Status and Price Variation
Hospitals often contend they must charge higher prices to private insurers because they treat sicker patients. When examining the health status of patients using services in the two settings, no differences were found for knee MRIs and colonoscopies.7 However, patients receiving lab tests and physical therapy services in hospital outpatient departments were sicker than those receiving these services in community settings. Since the analysis examined common and standardized clinical laboratory services, this should not be a factor in explaining clinical laboratory price differences. Although evidence is lacking to assess whether physical therapists in HOPDs are better qualified to treat sicker patients or those with more complex conditions than therapists in community settings, the health status difference might be explained because patients with hospital inpatient stays—say for a knee replacement—are more likely to be referred to physical therapy in HOPDs than in community settings.8
Back to Top
Prices Vary Across and Within Local Markets
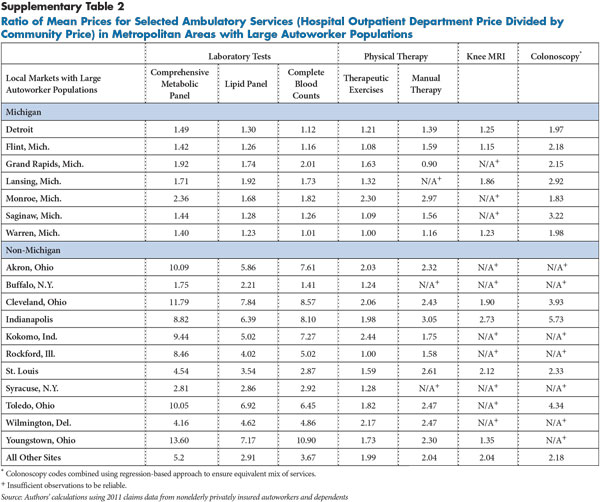
Across 18 metropolitan areas with large numbers of autoworkers and retirees, there were substantial differences in the ratio of HOPD to community prices across market areas for all of the services examined. Although average prices in community settings varied across markets, average prices in hospital outpatient departments varied much more across markets than prices in community settings. This finding is consistent with prior research that found substantial variation in outpatient prices across metropolitan areas, as well as substantial variation within metropolitan areas.9
In general, communities—for example, Indianapolis, Cleveland and Toledo, Ohio—with high HOPD prices relative to community-based prices for one service also had relatively high HOPD prices for other services (see Supplementary Table 2). For instance, in Indianapolis, the average HOPD price for knee MRIs was $1,540—more than 2.7 times the $563 average price in community settings. Previous research also found that these communities have average high inpatient hospital prices.10 Some Michigan markets had less price variation across care HOPD and community settings than other communities, possibly reflecting arrangements between the dominant insurer, Blue Cross Blue Shield of Michigan, and many Michigan hospitals to keep HOPD prices lower in exchange for higher inpatient rates.11
In various locations and for different services, HOPD services can be many times greater on average than community prices. In markets with adequate numbers of observations in both settings, colonoscopies tended to range from two to four times higher in HOPDs than community settings. For example, colonoscopies in Indianapolis averaged $2,573 in HOPDs and $449 in community settings, a nearly six-fold difference.
Price variation across markets was greatest for laboratory tests. Depending on the specific test and market, average HOPD prices ranged from almost being on par with average community prices— example, CBC tests averaged $10.21 in Detroit HOPDs compared to $9.14 in community settings— being nearly 14 times higher—$76.38 vs. $5.61 for combined metabolic panels in the Youngstown, Ohio, metropolitan area.
The large variation in the relative prices of HOPD and community-based services across markets suggests that apart from explanations for higher HOPD prices because of greater overhead costs and sicker patients, there are likely large differences in the bargaining clout of hospitals relative to health plans that allow some hospitals to negotiate much higher prices than others, as other research has shown.12
Back to Top
Implications for Purchaser Strategies
Large price differences between HOPD and community settings, particularly in some markets, offer an opportunity for purchasers to reduce spending by steering patients to lower-price providers. Such actions also could pressure hospitals to lower their outpatient prices. Based on the sample of services examined, the study results indicate that substantial savings could be achieved by encouraging the use of lower-price community options, even without downward pressure on HOPD prices.
Purchasers can structure health benefits in several ways to encourage patients to use lower-price providers, including narrow networks that exclude higher-price providers; tiered networks that require higher patient cost sharing to use higher-price providers; and reference pricing that caps allowed payment amounts for certain services for in-network providers.
Narrow-provider networks. Under a narrow-network approach, purchasers include only lower-price providers in their health plan network and exclude higher-price providers. If patients use non-network providers, they must pay the entire cost of care out of pocket. In forming narrow networks, cost considerations must be weighed against ensuring adequate access to high-quality services and providers.
Tiered-provider networks. Under tiering, health plans can place network providers on tiers, based on their prices and quality. Patients who use providers in the preferred tier enjoy the lowest cost sharing, while others pay more out of pocket if they opt for providers in a non-preferred tier. However, during negotiations with health plans, powerful hospitals may insist on being placed in the preferred tier, regardless of how their prices compare to those from other hospitals, often rendering this approach unworkable. Massachusetts passed a law prohibiting hospitals from inserting these clauses into hospital-insurer contracts.
Reference pricing. Under reference pricing, purchasers cap the allowed amount they will pay in-network providers for a particular service, and if patients opt to use a network provider with higher prices than the reference price, patients must pay any cost above the allowed amount. While reference pricing is common for pharmaceuticals, only a handful of purchasers have adopted the approach for medical services. The California Public Employees’ Retirement System (CalPERS), which covers 1.3 million active and retired state and local workers and their dependents, initially adopted reference pricing for hip and knee replacements, which are done in the inpatient setting. More recently, CalPERS expanded the approach to outpatient services, including cataract surgery and colonoscopies.13
Other private employers, such as grocery chains Safeway and Kroger, have used reference pricing for outpatient services, such as colonoscopies, imaging and lab tests, as well as selected pharmaceuticals and supplies. Effective use of reference pricing requires giving patients information about which providers’ prices are at or below the reference price and ensuring access to enough providers meeting quality standards that have prices within the reference price.
The feasibility of using these purchaser strategies could depend on the structure of local health care markets, in particular on whether sufficient independent community-based providers exist. Along with widespread hospital consolidation in many markets, hospitals in some markets have aggressively purchased physician practices and other types of community-based providers in recent years. Hospital-owned physician practices and facilities, even if they are not on the hospital campus, may still be designated as a “hospital-based facility” and be paid at hospital outpatient department rates. While the price comparisons in this analysis excluded community-based providers that appeared to be owned by hospitals, average prices for services conducted in these community-based, hospital-owned facilities were close to HOPD averages.
Back to Top
Notes
Back to Top
Technical Appendix
The study examined services commonly provided in both hospital outpatient departments (HOPDs) and community settings—MRIs of the knee, colonoscopies, common laboratory tests and physical therapy services—using detailed 2011 facility and professional claims data for current and retired autoworkers and their dependents under age 65. The data include detailed information on the service provided, the type of provider, the allowed amount—the total amount paid to the provider, including amounts paid by the insurer and the patient. Markets for which price comparisons were generated in this Research Brief had 10,000 or more enrollees in the autoworker plans, and unless indicated, had at least 75 HOPD and 75 community-based observations to make reliable comparisons for the services investigated. Only claims with a clear HOPD or community site of service were included in the study.
The price comparisons were only for services or procedures provided to ambulatory patients and excluded services provided during an inpatient hospital stay and services provided on the same day a patient had an emergency department or urgent care visit because these patients are unlikely to be in a position to shop for lower-price providers.
For all but laboratory services, calculating the price of a service in some cases required combining multiple bills (claims) from different providers who provided different components of the service. To identify these components, claim line items were grouped for a given patient on a specific day that included the service or procedure being examined. Most medical services and procedures are classified using Current Procedural Terminology (CPT) codes, and CPT codes were used to identify and select the services/procedures investigated. Once claim items associated with a given service/procedure were identified, the allowed amounts from all components were summed to calculate the total allowed amounts, or price. In some cases, “modifier codes” with additional information about the service were used because such codes can affect provider payments.
The type of claim, modifier codes and a claim field identifying the type of provider were used to classify service locations as either a HOPD or a community setting. For most services, payment is divided into two components—a “facility” component (or in the case of imaging procedures a “technical” component) that covers labor and equipment costs associated with the location where the service or procedure took place, and a “professional” component that covers the labor costs of the physician or other medical professional involved.
If one has a doctor’s visit in a community-based office, for instance, the price paid for that visit typically includes both facility and professional components. Similarly, if physicians provided an X-ray or other imaging scan in their office and interpreted the image, then both the technical and professional components of that procedure would typically be contained in a single claim. However, if a service is provided in a hospital (or certain other types of facilities), the facility and professional components are typically billed separately and show up in different claims. A visit taking place in a HOPD, for example, would generate two claims, one for each component. This allowed identification of HOPD services by using the type of provider field in the claims. There are also community-based services where the facility/technical and professional components are billed separately. Examples include procedures conducted in a community-based ambulatory surgical center or an imaging scan conducted by one community-based organization that then sends the scan to a radiologist in a different organization for interpretation.
In general, claims for procedures/services that included a facility or technical component indicating the service was provided in a hospital were classified as HOPD, while those with components exclusively from professional claims were classified as community based. Services/procedures were excluded from price comparisons if the site of service could not be determined. Lab tests were classified based only on the type of claim (facility vs. professional) and type of provider. Since multiple units of specific physical therapy services can be provided in a visit, price comparisons were done using a single unit of service.
For colonoscopies, the price included the range of drugs and services typically associated with colonoscopies billed on the same day as the colonoscopy procedure. The site of service was determined by where there the colonoscopy facility charges emanated from. The average mix of services related to colonoscopies in HOPDs did not significantly differ from those in community settings.
To ensure that observations with uncommonly large or uncommonly small prices did not overly influence the averaged prices reported, the top and bottom 1 percent of HOPD and community observations for each procedure/service examined were excluded.
Additionally, no adjustments were made for differences in price levels across geographic areas attributable to differences in local wage rates and other input costs. Previous research on inpatient care indicated that these prices differences are minor.1
1 White, Chapin, Health Status and Hospital Prices Key to Regional Variation in Private Health Care Spending, Research Brief No. 7, National Institute for Health Care Reform, Washington, D.C. (February 2012).
Back to Top
Supplementary Tables
Back to Top
Data Source
This Research Brief uses detailed 2011 facility and professional claims data for current and retired autoworkers and their dependents under age 65. General Motors, Chrysler, Ford and the UAW Retiree Medical Benefits Trust provided access to the claims data. The data include detailed information on the service provided, the type of provider, the allowed amount—the total amount paid to the provider, including amounts paid by the insurer and the patient. Price comparisons were generated in 18 metropolitan areas with 10,000 or more enrollees in the autoworker plans, and each community had at least 75 HOPD and 75 community-based observations to make reliable comparisons for the services investigated (see the Technical Appendix for more about the study’s methodology). The 18 metropolitan markets are Akron, Ohio; Buffalo, N.Y.; Cleveland; Detroit; Flint, Mich.; Grand Rapids, Mich.; Indianapolis; Kokomo, Ind.; Lansing, Mich.; Monroe, Mich.; Rockford, Ill., Saginaw, Mich.; St. Louis; Syracuse, N.Y.; Toledo, Ohio; Warren, Mich.; Wilmington, Del.; and Youngstown, Ohio.