When including all care related to a hospitalization—for example, a knee or hip replacement—the price of the initial inpatient stay explains almost all of the wide variation from hospital to hospital in spending on so-called episodes of care, according to a study by researchers at the former Center for Studying Health System Change (HSC) based on 2011 claims data for 590,000 active and retired nonelderly autoworkers and dependents. For example, average spending for uncomplicated inpatient knee and hip replacements ranged across 36 hospitals from less than $17,500 to $37,000 for an episode of care that included all services during the inpatient stay and all follow-up care within 30 days of discharge. The pattern of spending variation for knee and hip replacements held true for other conditions, with hospital inpatient price differences accounting for the vast majority of spending variation rather than differences in spending on physician and other non-hospital services during and after discharge or spending on readmissions. Moreover, hospitals’ case-mix-adjusted relative spending per episode for different service lines—for example, orthopedics and cardiology—tend to be highly correlated with each other. Understanding why spending for episodes of care varies so much among hospitals can help private purchasers accurately target ways to control spending. This study’s findings—inpatient prices drive the bulk of episode-spending variation and hospitals with high spending for one service line tend to have high spending for other service lines—indicate that private purchasers can focus on hospitals’ overall inpatient price levels rather than pursue bundled payments for episodes of care or service-line-specific purchasing strategies.
- Understanding Spending Variation More Broadly
- To Bundle or Not to Bundle…
- Measuring Spending on Hospitalization Episodes
- Spending on Knee and Hip Replacement Episodes Varies Widely
- Inpatient Hospital Prices Drive Episode Spending Differences
- Episode Spending Tracks Across Service Lines
- Implications for Private Purchasers
- Notese
- Technical Appendix
- Supplementary Table
- Data Source
Understanding Spending Variation More Broadly
Previous research has shown that private health plans pay inpatient hospital prices that vary widely, both within and across local health care markets.1 Additionally, rising inpatient hospital prices have been a key component in recent spending growth for the privately insured.2 Most research to date, however, has focused just on the amounts paid per stay to hospitals for inpatient care, without examining variation in the prices and quantities of other medical services related to hospitalizations.
Breaking new ground, this analysis focuses on private health plans’ spending on episodes of care beginning with a hospitalization, including payments for the initial hospital stay, all physician services and rehabilitation during the stay and up to 30 days after discharge, and payments for any readmission within 30 days of the initial discharge. Spending per episode is a broader measure of how efficiently a patient is treated for a condition that involves a hospitalization. In the private claims data used in this analysis, hospital payments for initial inpatient stays accounted for two-thirds of total episode spending while related services accounted for a third (see Data Source).
This analysis compares variation in spending per episode with variation in hospital inpatient prices per discharge. If spending per episode varies even more widely than inpatient prices, that would indicate that cost-containment efforts should focus on curtailing spending on related services by, for example, paying hospitals or another provider entity a fixed—or bundled—payment for entire episodes of care. The analysis also measures hospitals’ spending per episode separately for broad service lines, such as cardiology or orthopedics, to test whether hospitals with high spending per episode for one service line also tend to have high spending per episode for other service lines.
Back to Top
To Bundle or Not to Bundle…
The idea of bundling payment for hospitalization episodes has circulated among policy makers and purchasers for decades. Under such an arrangement, a hospital or another provider entity receives a single payment to cover the costs of the inpatient stay plus related services during the stay and after discharge. The rationale is that bundled payments give hospitals, their medical staffs, affiliated physicians and post-acute providers a strong financial incentive to coordinate care during and after a hospital stay to avoid readmissions and unnecessary costs. The idea has gained significant traction lately both in Medicare and in private plans.3
In Medicare, there is a compelling case for bundled payments—wide variations in post-acute care use are the main factor behind differences between high- and low-spending geographic regions4 and between high- and low-spending hospitals.5 Moreover, Medicare patients often have multiple chronic conditions that are complex to manage. But the results of this analysis show that the case for bundled hospital payments for the privately insured is much weaker—post-acute care and other ancillary services account for a relatively small share of overall spending on hospitalization episodes, and they account for almost none of the variation in episode spending from one hospital to another.
Back to Top
Measuring Spending on Hospitalization Episodes
Spending for a hospitalization episode equals the prices—or allowed amounts—paid for the inpatient hospital stay plus the allowed amounts for other medical services rendered during the hospital stay and during 30 days after discharge. Other medical services can include physician care, prescription drugs, laboratory and imaging services, durable medical equipment, and so on. The allowed amount reflects the prices negotiated by the plan and providers and includes amounts paid by the insurer and by the enrollee. Spending on any readmissions during the 30-day post-discharge window was included in episode spending. To account for differences across markets in the cost of doing business, all allowed amounts were adjusted for local input costs (see Technical Appendix).6
In the claims data used in this analysis, the total allowed amounts for initial inpatient hospital stays were $263 million, and the total allowed amounts for related services were $126 million. The analysis included all medical and surgical admissions but excluded admissions for mental health or substance abuse treatment.7
Each hospital’s spending per episode was adjusted for the severity of patients’ conditions—often referred to as case mix—so hospitals are classified as high spending only if their spending per episode exceeds that of other hospitals treating a similar mix of patients. To do this, hospital stays were assigned to Medicare Severity-Diagnosis Related Groups (MS-DRGs), which categorize patients into nearly 1,000 groups based on their diagnoses, the treatments provided, and the presence of complications and comorbidities.
The first, and simplest, approach to comparing hospitals’ spending per episode was to measure average spending for one specific type of episode. Uncomplicated knee and hip replacements (MS-DRG 470 for “major joint replacement or reattachment of lower extremity without major complications or comorbidities”) were chosen because they are by far the most common MS-DRG in the autoworker claims data.8 Thirty-six hospitals provided 10 or more knee or hip replacement episodes to autoworkers during 2011, and knee and hip replacements accounted for 1,056 discharges—more than 6 percent of all discharges—and almost $30 million in total spending in 2011 for the study population. It also turns out that a hospital’s spending per episode for knee and hip replacements is highly indicative of spending for all types of episodes at that hospital.
To measure each hospital’s overall spending per episode across all episode types, hospitals were assigned an episode-spending index that equals the hospital’s total episode spending divided by a hypothetical total. The hypothetical total was calculated using the specific hospital’s mix of MS-DRGs and the average spending per episode among all hospitals for treating each MS-DRG. For example, if a hospital’s episode-spending index equals 1.2 that means that spending on episodes at that hospital was 20 percent higher than average spending for treating that mix of patients. Episode spending for a hospital can differ from the average either because of differences in the quantity of related services in each episode or differences in the prices paid for each service. To assess the roles of quantity and prices, episode-spending indexes were separated into price and quantity components for different types of related services.
Each hospital also was assigned a set of episode-spending indexes for specific service lines—orthopedics, gastrointestinal, cardiology, labor and delivery, respiratory, and neurology. Hospitalization episodes were grouped into service lines based on the MS-DRG of the initial stay, and then service-line-specific episode-spending indexes were calculated in the same way as the overall episode-spending index.
Back to Top
Spending on Knee and Hip Replacement Episodes Varies Widely
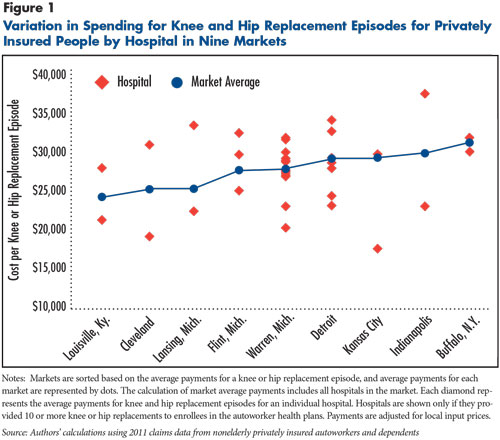
Spending per episode for uncomplicated knee and hip replacements (MS-DRG 470) varied more than twofold across the 36 hospitals that provided significant volumes to the autoworkers (see Figure 1). Among the lowest-spending hospitals, spending for knee and hip replacement episodes ranged from $17,000 to $20,000, dramatically lower than the highest hospitals, where spending was close to or more than $35,000. These spending variations appear even though the procedure and the recuperative process are fairly standardized, the population is fairly uniform (nonelderly manufacturing workers and retirees), and payments are adjusted for local input prices.
Average spending per knee and hip replacement episode also varied among the nine markets studied: Buffalo, N.Y; Cleveland; Detroit; Flint, Mich.; Indianapolis; Kansas City; Lansing, Mich.; Louisville, Ky.; and Warren, Mich. The market average spending per episode ranged from below $25,000 in Louisville to more than $30,000 in Buffalo. All but one of the markets had one or more low-spending hospitals—at or less than $25,000—and one or more high-spending hospitals—more than $25,000, suggesting that lower-spending hospitals are an option in most markets.
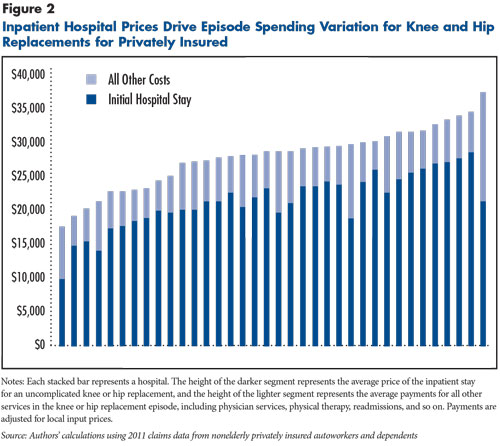
The next question was whether the spending variation among hospitals on knee and hip replacements is driven by differences in payments for the initial inpatient stay or payments for related services. Related services accounted for 23 percent of the total spending on knee and hip replacement episodes, but they accounted for very little of the variation across hospitals—the price of the initial inpatient stay was by far the most important factor in a hospital’s spending per knee and hip replacement episode (see Figure 2).
Back to Top
Inpatient Hospital Prices Drive Episode Spending Differences
Knee and hip replacements provide a useful illustration of variation in spending per episode, but they only account for 6 percent of all hospitalization episodes in the study. To get a broader measure of what is driving variation in episode spending, the analysis used overall episode-spending indexes that include all episode types. The variation among hospitals in the overall index was broken down into price differences for the price of the initial stay, the price of related services and the quantity of related services.
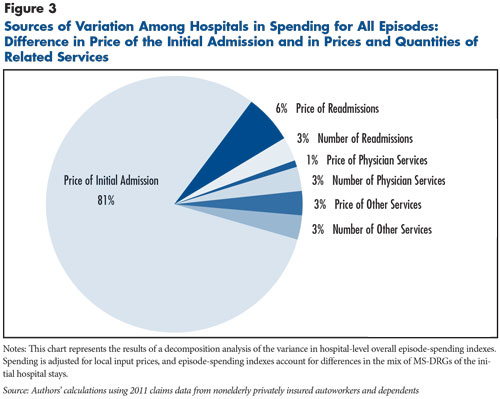
Initial hospital stays accounted for 68 percent of spending on hospitalization episodes, but differences in the prices of initial hospital stays accounted for an even larger share—more than 80 percent—of the variation in overall episode spending (see Figure 3). Differences in spending on readmissions contributed to variation in overall episode-spending indexes, but differences in the amounts paid per readmission were twice as important as the rate of readmissions in explaining variation in episode spending—6 percent vs. 3 percent. Variation in the prices and quantities of physician and other services together accounted for less than one-tenth of the observed variation in episode spending.
Back to Top
Back to Top
Episode Spending Tracks Across Service Lines
Hospitalization episodes were grouped into broad service lines based on the MS-DRG of the initial admission. Cardiology and orthopedics are the most important contributors to spending, together accounting for 40 percent of spending on all hospitalization episodes.
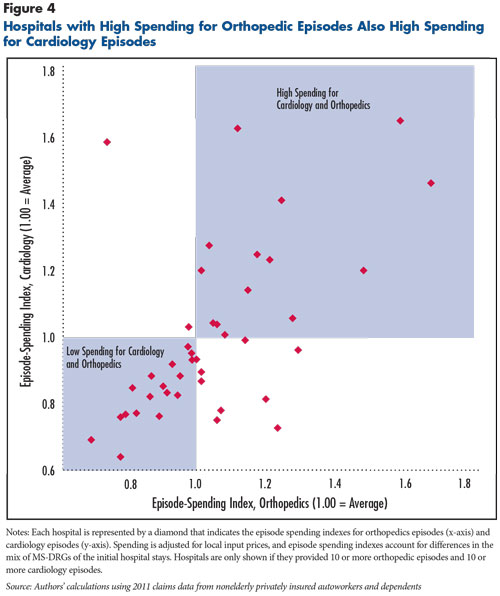
Of the 43 hospitals that provided significant volumes of both cardiology and orthopedics episodes, most had either above-average spending for both service lines—14 hospitals—or below-average spending for both service lines—18 hospitals (see Figure 4). A quarter of hospitals had higher-than-average spending for one service line and lower-than-average spending for the other. An important topic for future investigation is why some hospitals have high spending for one service line and low spending for another. One possibility is that some hospitals provide certain types of services much more efficiently than others. Another possibility is that limited sample size and random variation are reducing the apparent correlations among service lines.
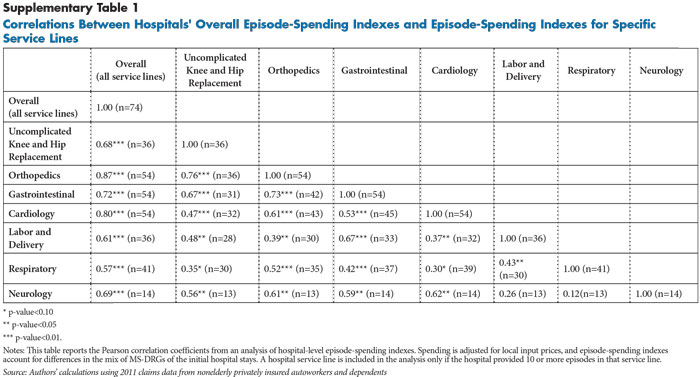
Looking beyond cardiology and orthopedics, episode-spending indexes for all service lines were highly correlated with the hospital’s overall episode-spending index (see Supplementary Table 1). Together these results suggest that if a hospital has high spending for one service line, it is also likely to have high spending for other service lines.
Back to Top
Implications for Private Purchasers
This analysis indicates that the challenge for private purchasers is relatively simple—privately negotiated inpatient hospital prices are generally high, and some hospitals command inpatient prices much higher than others. The response, however, is far from straightforward. High-price hospitals tend to have high-prices for a reason, because they have specialized service lines that other nearby hospitals do not offer, they are part of local hospital systems with greater bargaining clout, they have unusually good clinical reputations, or they are large teaching hospitals.9 Simply excluding high-price hospitals from a plan’s network could leave enrollees without in-network access to necessary specialized services.
Tiered-provider networks offer one approach for private purchasers to deal with high-price hospitals in areas where patients have hospital choices.10 Patients in tiered-network plans face higher cost sharing if they use providers in a nonpreferred tier. The approach has the advantage of maintaining a broad provider network, while steering patients toward lower-cost providers. The results of this analysis indicate that hospital inpatient services can be tiered in a fairly simple way—tiers need not be applied separately for different inpatient service lines, and hospitals can be assigned to tiers based just on their inpatient prices not their episode spending.
Reference pricing is another approach some purchasers have taken to steer patients away from high-price hospitals.11 The plan sets a maximum price it will pay for a specific procedure—the reference price—leaving the provider to either forgo any excess amounts or bill the patient the difference between the insurer allowed amount and the reference price. The most widely discussed example is the California Public Employees’ Retirement System (CalPERS), which set a ceiling of $30,000 for knee and hip replacements—that ceiling was a bit above the middle of the price distribution in the CalPERS plan but is at the high end of the prices paid for knee and hip replacements in the autoworker plans. The wide variation in spending on knee and hip replacements in the autoworker population illustrates the rationale for reference pricing. The drawbacks to reference pricing are that it can only feasibly be applied to “shoppable” services—patients need to be warned ahead of time if they are going to a high-price provider—and it potentially puts patients at risk for balance billing.
In some cases, powerful hospitals have stifled insurers’ attempts to institute tiering and reference pricing by refusing to contract with insurers if these features put them at a disadvantage relative to their competitors. It remains to be seen whether, going forward, the tools available to private purchasers—tiered benefits, reference pricing, and so on—can counteract hospitals’ significant market power. Some states—most notably Massachusetts—have imposed regulations on the contracts between insurers and hospitals to prohibit practices that impede tiering or reference pricing. Other more dramatic interventions, such as state-based hospital rate setting, or offering a “public option” that uses administered pricing through the state health insurance exchanges are options, albeit unlikely in most states to gain traction.
Back to Top
Notes
| 1. | Ginsburg, Paul B., Wide Variation in Hospital and Physician Payment Rates Evidence of Provider Market Power, Research Brief No. 16, Center for Studying Health System Change, Washington, D.C. (November 2010); White, Chapin, Health Status and Hospital Prices Key to Regional Variation in Private Health Care Spending, Research Brief No. 7, National Institute for Health Care Reform, Washington, D.C. (February 2012); White, Chapin, Amelia M. Bond and James D. Reschovsky, High and Varying Prices for Privately Insured Patients Underscore Hospital Market Power, http://hschange.org/CONTENT/1375/, Center for Studying Health System Change, Washington, D.C. (September 2013); and Office of Attorney General Martha Coakley, Examination of Health Care Cost Trends and Cost Drivers, Boston, Mass. (March 16, 2010). |
| 2. | Health Care Cost Institute, 2012 Health Care Cost and Utilization Report, Washington, D.C. (September 2013). |
| 3. | de Brantes, Francois, Meredith B. Rosenthal and Michael Painter, “Building a Bridge from Fragmentation to Accountability—The Prometheus Payment Model,” New England Journal of Medicine, Vol. 361, No. 11 (Sept. 10, 2009); Chapter 3 in Medicare Payment Advisory Commission, Medicare and the Health Care Delivery System: Report to the Congress, Washington, D.C. (June 2013); and Option 10 in Congressional Budget Office, Health-Related Options for Reducing the Deficit: 2014 to 2023, Washington, D.C. (December 2013). |
| 4. | Newhouse, Joseph P., and Alan M. Garber, “Geographic Variation in Health Care Spending in the United States: Insights From an Institute of Medicine Report,” Journal of the American Medical Association, Vol. 310, No. 12 (Sept. 25, 2013). |
| 5. | Mechanic, Robert, and Christopher Tompkins, “Lessons Learned Preparing for Medicare Bundled Payments,” New England Journal of Medicine, Vol. 367, No. 20 (Nov. 15, 2012). |
| 6. | Payments to facilities were divided by a weighted blend of one (30 percent) and the Medicare hospital operating wage index (70 percent). Payments to professionals were divided by a weighted blend of the “work” geographic practice cost index (GPCI, 48.3 percent), the “practice expense” GPCI (47.4 percent), and the “malpractice” GPCI (4.3 percent). Payments for prescription drugs were not adjusted. |
| 7. | Many admissions for mental health or substance abuse treatment were provided by specialized facilities, and pricing patterns for these services appear to diverge from pricing for other inpatient medical and surgical services. |
| 8. | In the autoworker claims data, 70 percent of inpatient stays in DRG 470 were for knee replacements and 30 percent were for hip replacements. |
| 9. | White, Chapin, James D. Reschovsky and Amelia M. Bond, “Understanding Differences Between High- and Low-Price Hospitals: Implications for Efforts to Rein in Costs,” Health Affairs, Web First (Jan. 29, 2014). |
| 10. | Mays, Glen P., Gary Claxton, and Bradley C. Strunk, Tiered-Provider Networks: Patients Face Cost-Choice Trade-Offs, Issue Brief No. 71, Center for Studying Health System Change, Washington, D.C. (November 2003). |
| 11. | Robinson, James C., Reference Pricing: Stimulating Cost-Conscious Purchasing and Countering Provider Market Power, National Institute for Health Care Management Foundation, Washington, D.C. (October 2013). |
Back to Top
Technical Appendix
Defining spending and episodes. Spending refers to the allowed amount, which reflects negotiated prices and equals the total amount paid to the provider, including amounts paid by the insurer and the enrollee. Each inpatient stay was assigned to an MS-DRG. An episode begins with the admission and includes the payments for the inpatient stay plus all services (facility, professional and prescription drugs) provided during the stay and up to 30 days after discharge.
This is a simple approach to defining episode spending that does not require an episode grouper and is similar to the 30-day version of Model 2 of the Bundled Payment for Care Improvement demonstration being conducted by the Innovation Center at the Centers for Medicare and Medicaid Services.1 This approach has the advantage of being straightforward, although some spending is inevitably included in a hospitalization episode that is not clinically related—for example, maintenance drugs for a chronic condition.
If the date of admission for an inpatient hospital stay was less than 30 days after the discharge date of the initial hospital stay, then the subsequent stay was included in the episode as a readmission. Hospitalizations that were defined as readmissions did not generate their own separate episodes. Some episodes that began late in 2011 were excluded because of incomplete data for the entire episode—episodes were only included in the analysis if the end date of the episode—the date of discharge plus 30 days—was Dec. 31, 2011, or earlier.
Adjusting for input prices. To make episode spending more comparable across hospitals and markets, allowed amounts were adjusted for input prices using Medicare payment adjustments before measurement of hospitals’ episode-spending indexes. Allowed amounts for facility claims were divided by a weighted average of the Medicare hospital wage index (70%) and one (30%). Allowed amounts for professional services claims were divided by a weighted average of the Medicare geographic practice cost indexes for physician work expense (48.3%), facility expense (47.4%) and malpractice expense (4.3%). Prescription drug claims were not adjusted.
Measuring each hospital’s overall episode-spending index, episode-spending indexes for service lines, and decomposing the contributions of prices and quantities to the variation in episode-spending indexes. For each specific type of service, including inpatient hospital stays, outpatient facility services, physician services, prescription drugs, etc., an average price was calculated using service-type identifiers (e.g., MS-DRG for inpatient hospital stays, CPT codes and modifiers for physician visits, NDCs for prescription drugs, and so on). The calculation of average price was based on allowed amounts and included all services in all of the 25 markets for which data were available for this study—not just the nine selected for the episode-spending analysis. Then, for each type of inpatient hospitalization episode, defined by MS-DRG, the average hypothetical episode spending was calculated using average prices for each specific type of service. Benchmark episode spending was calculated for each MS-DRG, both for the entire hospitalization episode and for specific service categories (e.g. initial inpatient stay, hospital readmissions, hospital outpatient services, etc.). Each hospital was then assigned a benchmark total spending for all hospitalization episodes, based on the number and type of MS-DRGs for that hospital. Then an overall episode-spending index was calculated for each hospital, equal to the total spending for all hospitalization episodes divided by the benchmark total spending. Each hospital’s excess overall episode-spending index—the episode-spending index minus one, which may be positive or negative—was then broken down into price and quantity components separately for each service category. For example, the excess quantity of physician services, which may be positive or negative, equals the total price-standardized payments for physician services (using actual quantities of physician services and average prices, summed over all of a hospital’s MS-DRGs) minus the total benchmark payments for physician services (using average quantities and average prices, summed over all of a hospital’s MS-DRGs). And, the excess price for physician services equals the total payments for physician services (using actual quantities and actual prices, summed over all of a hospital’s MS-DRGs) minus the total price-standardized payments for physician services (using actual quantities and average prices, summed over all of a hospital’s MS-DRGs). The contribution of the excess quantity of physician services to the hospital’s excess overall episode-spending index equals the excess quantity (measured in dollars) divided by the hospital’s benchmark total cost. By definition, the contributions of the excess quantities and prices for the various service categories sum to the hospital’s excess overall episode-spending index.
The share of variation in episode spending attributable to prices and quantities (summarized in Figure 4) was calculated using a decomposition of variance approach. This was done by calculating a 7 x 7 variance-covariance matrix using the 119 hospitals that: 1) are located in the nine selected markets, and 2) provided at least 10 inpatient hospitalization episodes to the autoworkers. The variance-covariance matrix is weighted by each hospital’s total actual spending for all hospitalization episodes. Each row-sum was then divided by the total variance, which produces that row’s contribution to overall variance in hospital-level episode spending.
1 Centers for Medicare and Medicaid Services, Center for Medicare and Medicaid Innovation, Bundled Payment for Care Improvement initiative, http://innovation.cms.gov/initiatives/BPCI-Model-2/index.html.
Back to Top
Back to Top
Data Source
This Research Brief uses detailed 2011 facility, professional and prescription drug claims data for current and retired autoworkers and their dependents under age 65. General Motors, Chrysler, Ford and the UAW Retiree Medical Benefits Trust provided claims for enrollees living in one of 25 selected metropolitan markets across the country and nonmetropolitan areas of Michigan. The claims data include detailed information on the service provided, the allowed amount—the total amount paid to the provider, including amounts paid by the insurer and the enrollee—and provider identifying information (name, zip code, tax identification number and national provider identifier). Markets were included in this Research Brief if they: 1) included 10,000 or more enrollees in the autoworker plans, and 2) two or more hospitals in the market provided 10 or more knee and hip replacements to the autoworker population. Nine markets met these criteria: Buffalo, N.Y; Cleveland; Detroit; Flint, Mich.; Indianapolis; Kansas City; Lansing, Mich.; Louisville, Ky.; and Warren, Mich.