As purchasers seek strategies to reduce high health care provider prices, interest in reference pricing—or capping payment for a particular medical service—has grown significantly. However, potential savings to health plans and purchasers from reference pricing for medical services are modest, according to a new analysis by researchers at the former Center for Studying Health System Change (HSC) using 2011 private insurance claims data for about 528,000 active and retired nonelderly autoworkers and their dependents. In 2011, the California Public Employees’ Retirement System (CalPERS) adopted reference pricing for inpatient knee and hip replacements. Using quality and price information, CalPERS set an upper limit of $30,000—the reference price—for hospital facility services for a knee or hip replacement. CalPERS designated certain in-network hospitals as meeting the reference price, and patients using designated hospitals are responsible only for the health plan’s usual cost-sharing amounts. However, if patients use a non-designated hospital, they are responsible for both usual cost sharing and any amount beyond the $30,000 reference price. While reference pricing for inpatient services has some potential to steer patients to hospitals with better quality metrics, only limited savings—a few tenths of a percent of total spending—are possible from applying a similarly narrow reference pricing to other privately insured populations. If reference pricing were applied to a much broader set of so-called “shoppable” inpatient and ambulatory services, potential savings would be somewhat larger—roughly 5 percent of total spending. The potential savings from reference pricing are modest for two reasons: Shoppable services only account for about a third of total spending, and reference pricing only directly affects prices at the high end of the price distribution. When considering reference pricing, employers and health plans need to weigh potential savings against increased plan complexity and financial risk to enrollees, along with the analytical and financial resources needed to create and manage the program.
- Reference Pricing: A Response to Price and Quality Variation
- CalPERS Blazes Path
- Simulating the Effects of Reference Pricing
- Shoppable Services
- Reference Pricing for Inpatient Care
- Reference Pricing for Ambulatory Care Services
- How Much Care is Shoppable?
- Designated Hospitals: Bigger, Better, Cheaper
- Potential Savings Concentrated in Ambulatory Services
- Implications
- Notes
- Technical Appendix
- Supplementary Table
- Data Source
Reference Pricing: A Small Piece of the Health Care Price and Quality Puzzle
The negotiated prices that private health plans pay for hospital and other health care services vary widely from market to market and from provider to provider, even after accounting for differences in service complexity and the local cost of doing business.1 At the same time, a growing body of research shows that paying higher prices does not necessarily mean patients receive higher-quality care.2
Wide, and seemingly unwarranted, price variation suggests that private health plans can reduce spending by steering patients to lower-price providers. Historically, health plans have used a combination of selective contracting and benefit design to steer patients to preferred providers—patients typically pay less out of pocket if they use in-network providers that have contracted with their health plan. Other providers are excluded from the plan network, and patients who receive care from out-of-network providers pay more, or even full charges, for services. Limited networks can be unpopular with enrollees and plan sponsors, but they have played, and will continue to play, a key role in health plan design.
Long used for pharmacy benefits, reference pricing for medical services is a relatively new approach to steering patients to particular providers and has received a great deal of attention recently.3 Although touted as a major innovation, reference pricing is a variation on conventional network-based plan design. The principle behind reference pricing is to maintain contracts with a broad network of providers but set an upper limit— reference price— the amount that health plans will pay in-network providers for a specific service. The enrollee is then liable for the usual cost sharing plus any excess of the negotiated in-network price over the reference price. Reference pricing has been referred to as a “reverse deductible” or a “defined-contribution” arrangement, because the plan covers amounts up to the reference price less usual cost sharing, and then the patient is liable for any amounts above the reference price.4
Back to Top
CalPERS Blazes Path
The most widely discussed example of reference pricing is operated by CalPERS, which has applied reference pricing to inpatient knee and hip replacements and ambulatory surgical and imaging procedures, including knee arthroscopies and colonoscopies.5 Under the CalPERS reference pricing system, patients who go to designated facilities are liable only for the usual cost sharing, but patients who go to non-designated providers are liable for the usual cost sharing plus any excess of the negotiated price over the reference price.
For inpatient hospital services, facilities are designated on the basis of quality metrics and average historical negotiated prices paid by CalPERS. For ambulatory services, all in-network freestanding centers are designated facilities, and hospital-based facilities, which tend to have higher prices, are not. As a result of the CalPERS reference pricing system, there was a substantial increase in the share of inpatient knee and hip replacements provided by designated facilities, and there was a dramatic decline in the amounts paid by the plan to non-designated facilities for those services.6 In general, it appears that non-designated facilities for joint replacements chose not to pursue collection of excess amounts above the reference price from CalPERS enrollees.
Back to Top
Simulating the Effects of Reference Pricing
The goals of this analysis were, first, to quantify the share of spending that is attributable to shoppable services and then to simulate the effects of reference pricing on those services. Two types of reference pricing were analyzed—one for inpatient hospital services and another for ambulatory services, including hospital outpatient services, professional services, and laboratory and imaging procedures. To simulate reference pricing for inpatient hospital care, certain hospitals were designated as high-value providers based on prices, quality and volume of services. For ambulatory services, service-specific reference prices were simulated, without designation of facilities or providers.
Two versions of inpatient reference pricing were simulated—a narrow one that only applied to knee and hip replacements, and a broader one that applied to all shoppable inpatient hospital stays. One of the key outcomes of interest was the simulated change in spending by the plan. In addition, the analysis of inpatient reference pricing also compared characteristics of designated vs. non-designated hospitals and average hospital quality metrics.
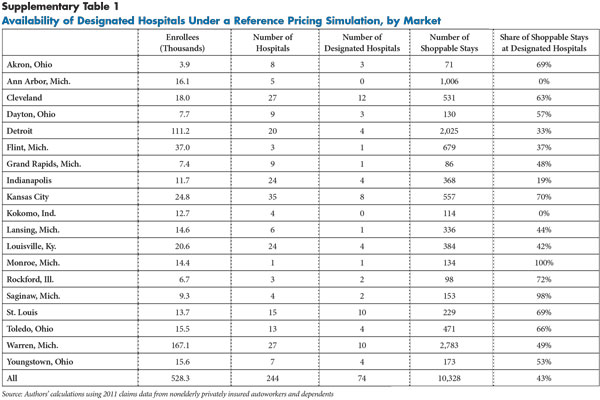
The data used for this analysis are from 2011 enrollment and claims data on 528,000 active and retired nonelderly U.S. autoworkers and their dependents (see Data Source and Technical Appendix). The simulation analysis was limited to 19 metropolitan markets, each with at least 4,000 enrollees, and all located in the Midwest (see Supplementary Table 1 for a list).
Back to Top
Shoppable Services
In general, a shoppable health care service must typically be scheduled in advance, there must be more than one provider in a market that can perform the service, and there has to be price data available for the different providers. Ideally, the patient also would have some information on each provider’s quality of care, or at least some reasonable assurance that quality does not vary much. Elective—nonemergency—knee and hip replacements are good examples of shoppable procedures: They are scheduled in advance, they are common and provided by many different hospitals and surgeons, health plans have accurate information on the prices they pay, and quality metrics are available.
To identify and classify shoppable services, this analysis used a combination of quantitative analysis of the claims dataset and clinician review to identify the maximum savings potential of reference pricing. Services were considered shoppable if they were among the top-ranked services in terms of total spending in the autoworker plan—either because of high prices, high quantities or both—and they could generally be scheduled in advance. Individual services that occurred within three days of an emergency department visit were excluded, even if the type of service was determined to be shoppable.
The list of shoppable services was not limited based on the availability of quality metrics, and services were included regardless of their potential use by plans to discriminate against seriously ill individuals. For example, injections of Avastin (generic name Bevacizumab) are included in the list of shoppable ambulatory services, although the drug is a chemotherapy treatment that, more or less without fail, would only be provided to individuals with colorectal cancer or other serious illnesses.
Finally, the analysis considered as shoppable some small-ticket services that patients would likely not shop for—such as electrocardiograms—but where the out-of-pocket liability might factor into a patient’s choice of physician. As a result, the list of shoppable services should be considered an outer bound. Adding a requirement that widely accepted quality metrics be available for shoppable services would narrow the range of shoppable services and lower the potential savings impact substantially.
The 100 highest-spending inpatient diagnosis-related groups (DRGs) in the study population were included for consideration as shoppable services. Together, these 100 DRGs accounted for approximately 70 percent of inpatient spending. Of these 100 DRGs, 73 were determined to be shoppable, including eight of the 10 DRGs accounting for the most spending.7 The top 300 ambulatory Healthcare Common Procedure Coding System (HCPCS) and Current Procedural Terminology (CPT) codes were considered in the identification of shoppable ambulatory services. Among these 300 services, approximately 90 percent were determined to be shoppable.8
Back to Top
Reference Pricing for Inpatient Care
In the simulation of reference pricing for inpatient care, hospitals were categorized as either designated or non-designated under two reference pricing structures—one applied solely to knee and hip replacements and one applied to all shoppable stays. The criteria for designation included volume (three or more stays), quality (either just for knee and hip replacements or using broader measures of quality) and price.
Publicly available quality measures were obtained from the Centers for Medicare and Medicaid Services (CMS) and used in the simulated designations. To be designated, facilities could not be worse than the U.S. national rate for selected quality measures.
The price for each visit was measured as the total payment to the facility during the stay, excluding non-facility payments, such as inpatient physician care, surgeon fees and post-acute care. For each hospital, two average prices were calculated, one for shoppable knee or hip replacements and another for all shoppable stays. Hospitals met the price criteria if their average facility price was below the 65th percentile among hospitals in the 19 markets. The 65th percentile was chosen because it is roughly analogous to the price criterion applied in the CalPERS system.9
Under this reference pricing strategy, designated hospitals would have prices at or below the reference price, and patients using non-designated hospitals would be responsible for paying the difference between the allowed amount and the reference price. The analysis simulated a steering effect in which some patients using a non-designated hospital would instead switch to a designated hospital. Results from the implementation of reference pricing by CalPERS indicated that roughly 15 percent to 30 percent of patients who would have gone to non-designated hospitals switched to a designated hospital in the first year.10 Based on the CalPERS experience, the simulation was carried out assuming a switching rate of 30 percent. The outcomes of interest in the simulation included changes in quality, prices and the distance from a patient’s residence to the hospital after taking this switching into account.
Back to Top
Reference Pricing for Ambulatory Services
Reference prices for ambulatory services were applied service by service based only on prices. This system did not distinguish between designated and non-designated facilities for two reasons: Quality metrics are not publicly available for such services, and data limitations made it difficult to identify specific facilities and professionals within the claims data used for the analysis. Simulating reference pricing without a so-called safe harbor for designated providers tends to lead to larger estimates of reference pricing’s spending impact.
Under this strategy, a reference price is calculated for each type of service. The price of a service could include both an outpatient facility component and a professional component. One such example would be the combination of the facility fee for an MRI procedure with a radiologist’s professional fee for reading the scan. For each service, the reference price was set at the 65th percentile of prices among all visits, again excluding those that occurred within three days of an emergency department visit. The simulation analysis assumed that all prices above the 65th percentile would be reduced to the reference price limit, and the excess would be transferred to the patient as a balance bill. The main outcome of interest was the change in spending by the plan under the simulated reference pricing structure.
Back to Top
How Much Care is Shoppable?
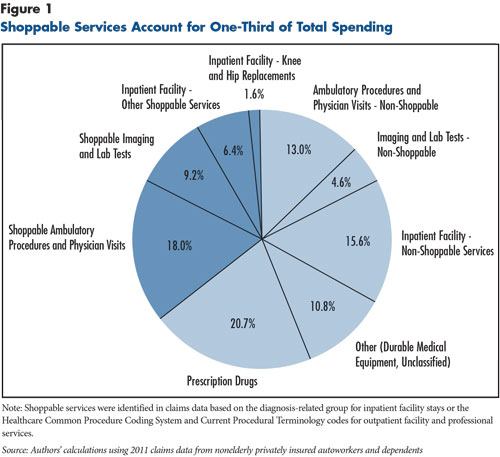
Elective knee and hip replacements, the archetypal shoppable procedure, are the most common type of inpatient stay in the 2011 autoworker claims data, but they only accounted for 1.6 percent of the autoworkers’ total health care spending (see Figure 1). The potential savings from applying reference pricing would be only a fraction of that relatively small share, or 0.2 percent of total spending. All other shoppable inpatient stays accounted for 27.2 percent of inpatient spending and 6.4 percent of total spending.
Using an inclusive definition, all shoppable services accounted for about a third of total spending if both inpatient and ambulatory services are included. In the autoworker claims data, spending on shoppable services occurred primarily in hospital outpatient departments and physician offices (18.0% of total spending) and in imaging and laboratory facilities (9.2% of total spending). Although the prices of individual ambulatory services are generally far lower than the price of an inpatient hospital stay, ambulatory services collectively are much more common and more substantial from a spending perspective.11
Back to Top
Designated Hospitals: Bigger, Better, Cheaper
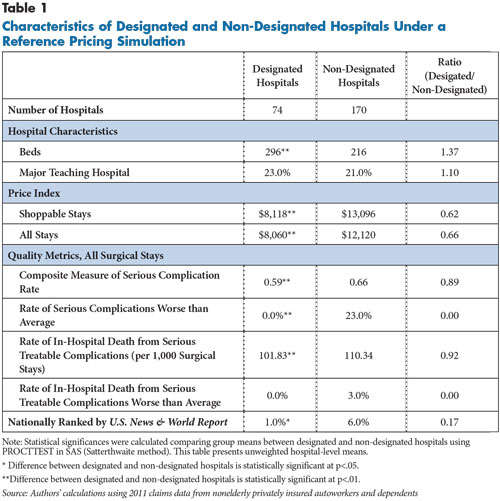
Hospitals in the simulations were designated as high-value providers for inpatient care based on a combination of CMS quality metrics and the prices and volume of shoppable inpatient stays in the claims data. Based on these criteria, 30 percent of hospitals in the 19 selected markets were designated as high-value providers (74 of 244) and accounted for 43 percent of shoppable inpatient stays (see Table 1).
Prices show the starkest difference between designated and non-designated hospitals. The case mix-adjusted average price per stay for shoppable stays was 38 percent lower at designated hospitals than at non-designated hospitals ($8,118 vs. $13,096). That price gap is almost as large—34 percent—when both shoppable and non-shoppable stays are included, which is consistent with prior research showing that hospitals’ prices for certain types of inpatient services are highly correlated with prices for other types of services.12
Designated hospitals were 37 percent larger than non-designated hospitals, as measured by the number of staffed beds. That size difference reflects that smaller hospitals were more likely to lack three or more shoppable stays in the claims data. The rates of serious complications and in-hospital deaths were roughly 10 percent lower in the designated hospitals, reflecting that hospitals could only be designated if their quality scores were either average or better than average.
The differences between designated and non-designated hospitals reflect the particular criteria applied. But there are many other ways that hospitals could be designated as high-value providers, and scoring highly on the metrics used in this study does not necessarily imply scoring highly on other metrics. To get a sense of the level of divergence between the designations in this analysis and other quality metrics, the share of hospitals that were nationally ranked by U.S. News & World Report (USNWR) was examined. Being nationally ranked by USNWR was significantly more common among hospitals that were not designated—either because of high prices or poor performance on CMS quality measures – than among designated hospitals. That divergence suggests that the roster of designated hospitals will likely differ substantially depending on which quality criteria are applied.
CalPERS, when designating hospitals, tried to ensure geographic access for enrollees living in all parts of California. The simulations in this analysis do not include any geographic-access requirements. Even so, 17 of the 19 selected markets had at least one designated hospital. Before applying reference pricing, a health plan would have to assess, for example, whether it is reasonable to expect residents of Kokomo, Ind., to drive more than an hour to a designated hospital in Indianapolis.
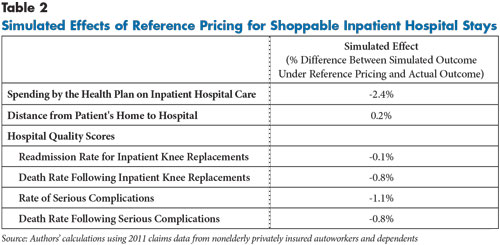
The simulated effects of applying reference pricing to all shoppable inpatient stays are fairly modest (see Table 2). Although it was assumed that 30 percent of patients who went to non-designated hospitals would switch to designated hospitals, there was almost no change (plus 0.2%) in the average distance from the patient’s home to the hospital. Total simulated spending by the plan on inpatient care was 2.4 percent lower, and, in the simulation, patients were treated at hospitals with slightly better quality metrics on average, as measured by readmission rates and rates of serious complications and death. The potential additional financial liability faced by patients was equal to 4.4 percent of actual total spending on inpatient hospital care. Based on the CalPERS experience, however, hospitals tend to forgo collection from patients of amounts exceeding the reference price.
Back to Top
Potential Savings Concentrated in Ambulatory Services
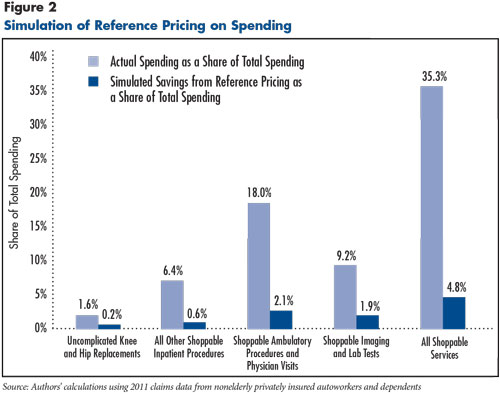
Imaging and laboratory tests accounted for 13.9 percent of total spending in the autoworker claims, but most of that spending is for shoppable services, and the prices for shoppable services vary widely. As a result, the simulated savings to the plan from applying reference pricing to imaging and laboratory tests equals 1.9 percent of total spending, roughly three times as large as the potential savings from applying reference pricing to all shoppable inpatient hospital stays (see Figure 2). Steering enrollees to lower-price providers was not included in the simulation of ambulatory services, therefore, the potential savings to the plan are equal to the potential additional liability faced by patients receiving services with prices above the reference price.
Outpatient hospital services and physician office visits accounted for almost one-third of total spending, and most of that spending was on shoppable services. The pool of spending on shoppable services is much larger for outpatient and office-based services than for imaging and laboratory tests (18.0% of total spending vs. 9.2%). However, the potential savings from applying reference pricing to outpatient and office-based services (2.1% of total spending) is similar to that of imaging and laboratory services (1.9%). Although prices for outpatient and office-based services vary widely, they do not vary as widely as for imaging and laboratory tests, which limits the potential savings from reference pricing.13
Back to Top
Implications
The CalPERS reference pricing experience tells two different but equally true stories—a dramatic percentage decline in prices and spending on knee and hip replacements and an extremely small percentage decline in total spending. To significantly impact spending among the privately insured, reference pricing would have to be applied quite broadly. And, even using a very inclusive list of shoppable services, the potential savings are relatively modest. Alternatively, purchasers might want to consider a targeted reference pricing program aimed at especially egregious provider pricing practices. Based on this study’s findings, ambulatory services generally and imaging and lab tests in particular are potential candidates for a more-targeted reference pricing program.
Both conventional network-based plans—preferred provider organizations and health maintenance organizations—and reference pricing suffer some of the same limitations. Both types of plans rely on patient cost-sharing differentials to steer patients to certain providers, but the higher cost sharing cannot reasonably be applied in emergencies when patients can’t choose their provider. Also, both types of plans are vulnerable to the demands of dominant “must-have” providers, either to be in network or to be both in network and designated.14
Compared to a limited-network plan, reference pricing faces at least three additional logistical hurdles. First, the health plan must have reliable price data for specific providers for specific services so that it can set the reference price and designate providers. Even very large plans will lack the historical data to accurately measure the prices they typically pay to smaller hospitals. Second, the plan would ideally have provider-specific quality metrics on hand that can be used to assure patients that they are not being steered to low-quality providers. Although hospital quality metrics and rankings abound, the methodologies behind those rankings are still under development. Third, reference pricing requires new customer-service tools to support shopping by patients and to deal with inevitable member complaints. These efforts might include traditional mailings, a call center and online support. Implementation would require commitment of significant resources by the plan, potentially offsetting some or all of the savings from reductions in payments to high-price providers.
Reference pricing has some advantages and disadvantages compared to a conventional network-based plan. The main advantage of reference pricing is that it can steer patients to more-efficient providers but without the disruption of outright excluding some providers from the plan’s network. The main disadvantage of reference pricing is that it adds a new layer of complexity for plan administrators and enrollees. Rather than facilities simply either being in or out of the network, there are now three types of facilities: in-network designated, in-network non-designated and out of network. Even more confusingly, a single facility might be designated for one type of service— example, an inpatient hospital providing a knee replacement— not designated for another— same hospital providing a colonoscopy in an outpatient department. Additional complexity raises significant concerns, given that the basic elements of conventional benefit design are already beyond the grasp of many consumers.15
One question is whether a reference pricing program can steer patients to lower-price, adequate-quality providers. The answer, based on the CalPERS experience, appears to be yes. But, that may not be the right question. A better question may be why private health plans would ever pay negotiated prices over $30,000 for inpatient knee and hip replacements. The CalPERS reference pricing program seemingly took a hard line against hospitals charging unreasonably high prices—$30,000 or more— knee and hip replacements. But, is $30,000 really a reasonable price for an inpatient knee or hip replacement? To put that amount in perspective, the Medicare program on average paid $14,324 for inpatient knee and hip replacements in 2011.16
Reference pricing can be helpful in exposing and drawing scrutiny to high and widely varying negotiated prices that private health plans pay. However, reference pricing lays the responsibility for dealing with those prices on patients. Along with leaving patients potentially liable for significant cost sharing if they receive services from non-designated providers, reference pricing adds another layer to already complex benefit designs. From a plan management perspective, the analytical and financial resources needed to establish a reference pricing system might be better invested in other activities, such as narrowing the plan’s physician network or renegotiating outlier facility contracts. Reference pricing may be a useful step on the path to more reasonable pricing, but it is by no means the final destination.
Back to Top
Notes
Back to Top
Technical Appendix
Data Source
This Research Brief uses detailed facility and professional 2011 claims data for current and retired autoworkers and their dependents under age 65. General Motors, Chrysler, Ford and the UAW Retiree Medical Benefits Trust provided claims for 528,000 enrollees living in 19 selected metropolitan markets as well as nonmetropolitan areas of Michigan. The claims data include detailed information on the service provided, the allowed amount—the total amount paid to the provider, including amounts paid by the insurer and the enrollee—and provider identifying information (name, zip code, tax identification number and national provider identifier). See the Technical Appendix for additional methodology information.